PHP xDebug – xampp – php 7 – chrome [ 1685 views ]
Goal: not a question, how we can know what is under the hood
The PHP debugging is not a trivial case. Could be with the xDebug extension. Follow these steps:
A. Xdebug core environment
prepare the debugger
1. get the xDebug extension: http://xdebug.org/files/php_xdebug-2.4.0rc3-7.0-vc14.dll
2. copy this file to the xampp ext directory (the default dir: C:\xampp\php\ext)

set the xampp
3. edit the php.ini file (the default path: C:\xampp\php\php.ini)
4. create an XDebug section in the ini file

[XDebug]
zend_extension = "c:\xampp\php\ext\php_xdebug-2.4.0rc3-7.0-vc14.dll"
xdebug.profiler_append = 0
xdebug.profiler_enable = 0
xdebug.profiler_enable_trigger = 0
xdebug.profiler_output_dir = "c:\xampp\tmp"
xdebug.remote_enable = 1
xdebug.remote_handler = "dbgp"
xdebug.remote_host = "127.0.0.1"
xdebug.remote_log="c:\xampp\tmp\xdebug.txt"
xdebug.remote_port = 9000
xdebug.trace_output_dir = "c:\xampp\tmp"
xdebug.remote_cookie_expire_time = 36000

5. restart the apache
notice: according to the internet you need to disable the output buffering output_buffering = Off
for me working with the following output_buffering=4096…
so if you want just disable the buffering. You will see.
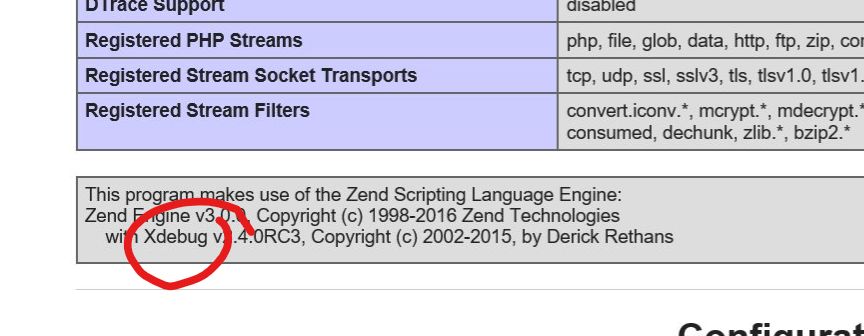
After the apache restarted check the xampp dashboard, hopefully you will see the following
http://localhost/dashboard/phpinfo.php
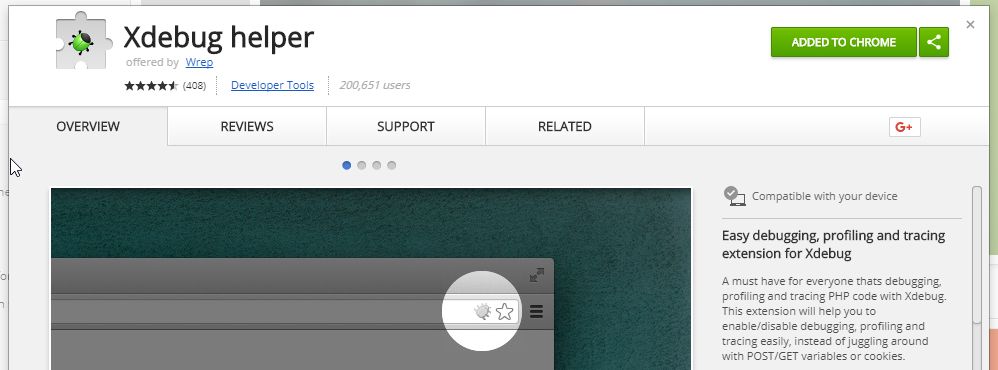
B. Chrome Xdebug helper extension
To prepare the chrome you need the Xdebug helper extension
After the install, start the debug. You have to see a green bug 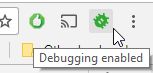
C. debugger application
You have million of options to interact with the xdebug core. The following is a simple just debugger (not editor) option
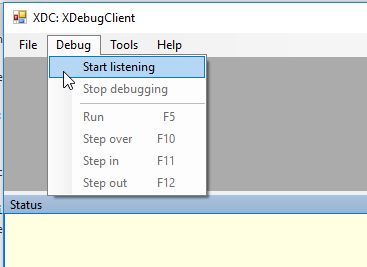
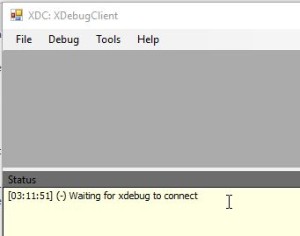
XDebugClient
Frankly a little bit buggy but useful.
D. eat the result
The Xdebug core is working, the chrome extension is on, the debugger application is listening… click on the link
http://localhost/dashboard/phpinfo.php
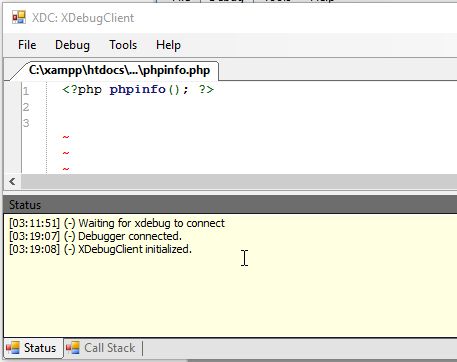
If everything is fine you will see the browser will wait and the XDebugClient will start the debugging as you can see:
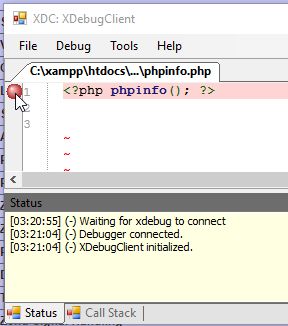
You can use the F5, F10, F11 to control the debugger, but first step in to the process… click on the margin and add a breakpoint to the code like:
and step into the debugger – press F5
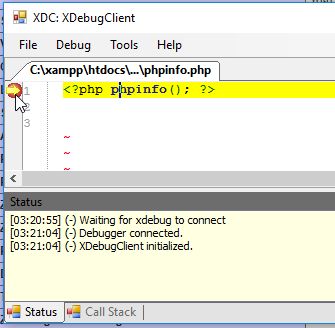
… you can debug the code now…
simple, useful, enjoy
Thursday, December 21st, 2017 at 02:40.
Filed under php , xampp
 .
.